Interactive Data Maps

Below are a series of maps you can use to explore data for your local community. Each map link below will take you to a new page where you will be able to zoom in and out of different parts of Los Angeles County. Each map has a description and legend to explain the data displayed on the map.

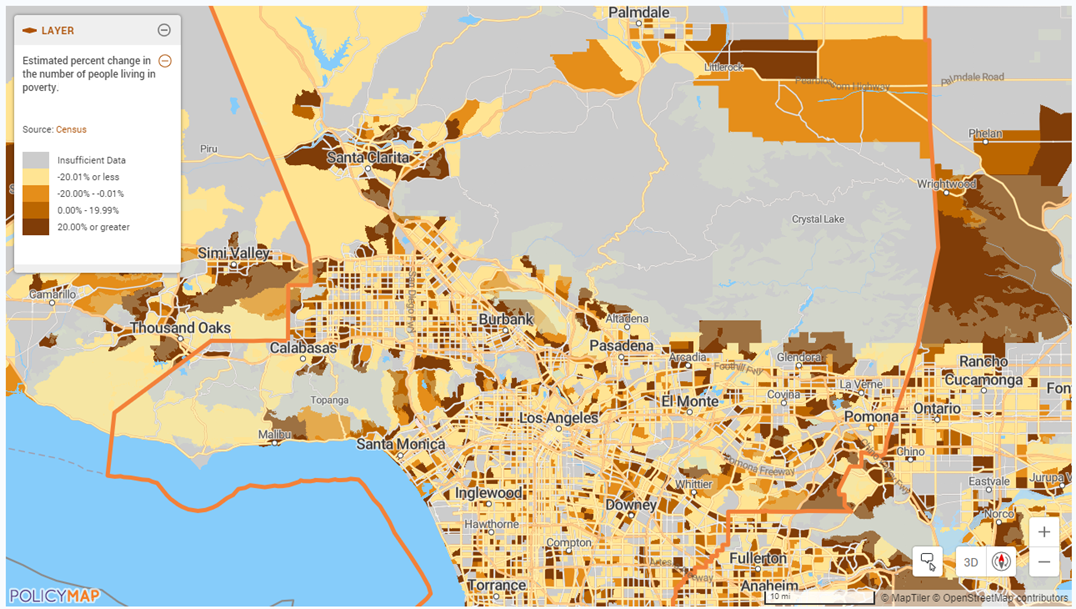
People Living In Poverty

Estimated Percent Change in the Number of People Living in Poverty, between 2011-2015 and 2016-2020

Cost-Burden Renters

Estimated Percent Change in the Number of Renters who are Cost-Burdened, between 2011-2015 and 2016-2020

Cost-Burden Homeowners

Estimated Percent Change in the Number of Homeowners who are Cost-Burdened, between 2011-2015 and 2016-2020

Racial or Ethnic Groups

Predominant Racial or Ethnic Groups, between 2016-2020

Racial Segregation

Racial Segregation (according to the Theil Index), 2010

Non-English Speaking Persons

Estimated Percent of All People Age 5 or Older who were Non-English Speaking, between 2016-2020

Persons With Disabilities

Estimated Percent of People with One or More Disabilities, between 2016-2020

Education Levels

Estimated Percent of People with at Least a High School Diploma, between 2016-2020

Social Vulnerability

Social Vulnerability Level, as of 2018